Restore landscapes, prove impact, all in one place
The field-to-report platform for ecological restoration. Track riparian corridors, monitor forest health, and prove impact to funders -- all from one place.
Built for the Field
Tools shaped by the land and the work
Every feature is designed for restoration practitioners -- from streamside monitoring crews to grant-writing program directors.
Spatial Project Tracking
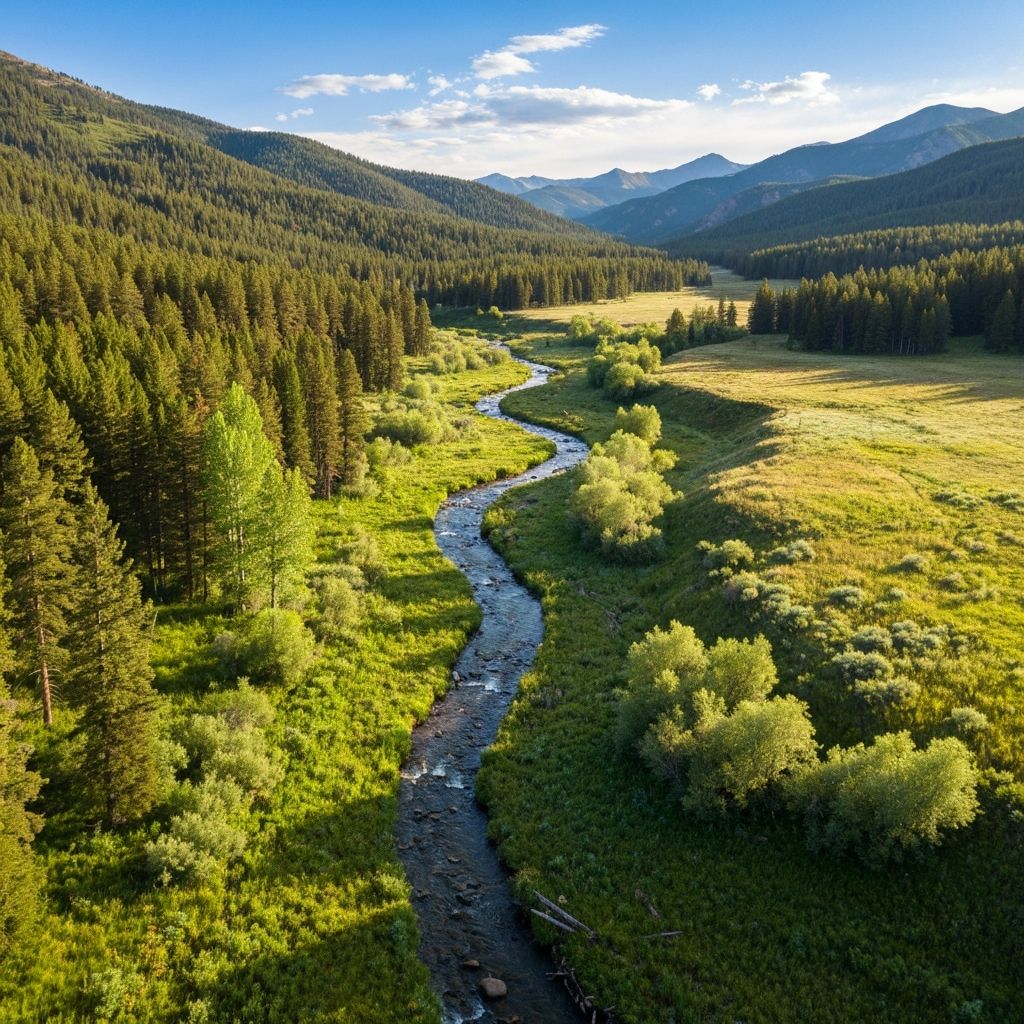
Draw restoration boundaries on interactive maps. Visualize riparian corridors, forest stands, wetland parcels, and grassland sites with full spatial context.
Vegetation & Habitat Logging
Record vegetation surveys tracking survival rates, canopy cover, native cover, and tree density. Attach geotagged photos directly from the field.
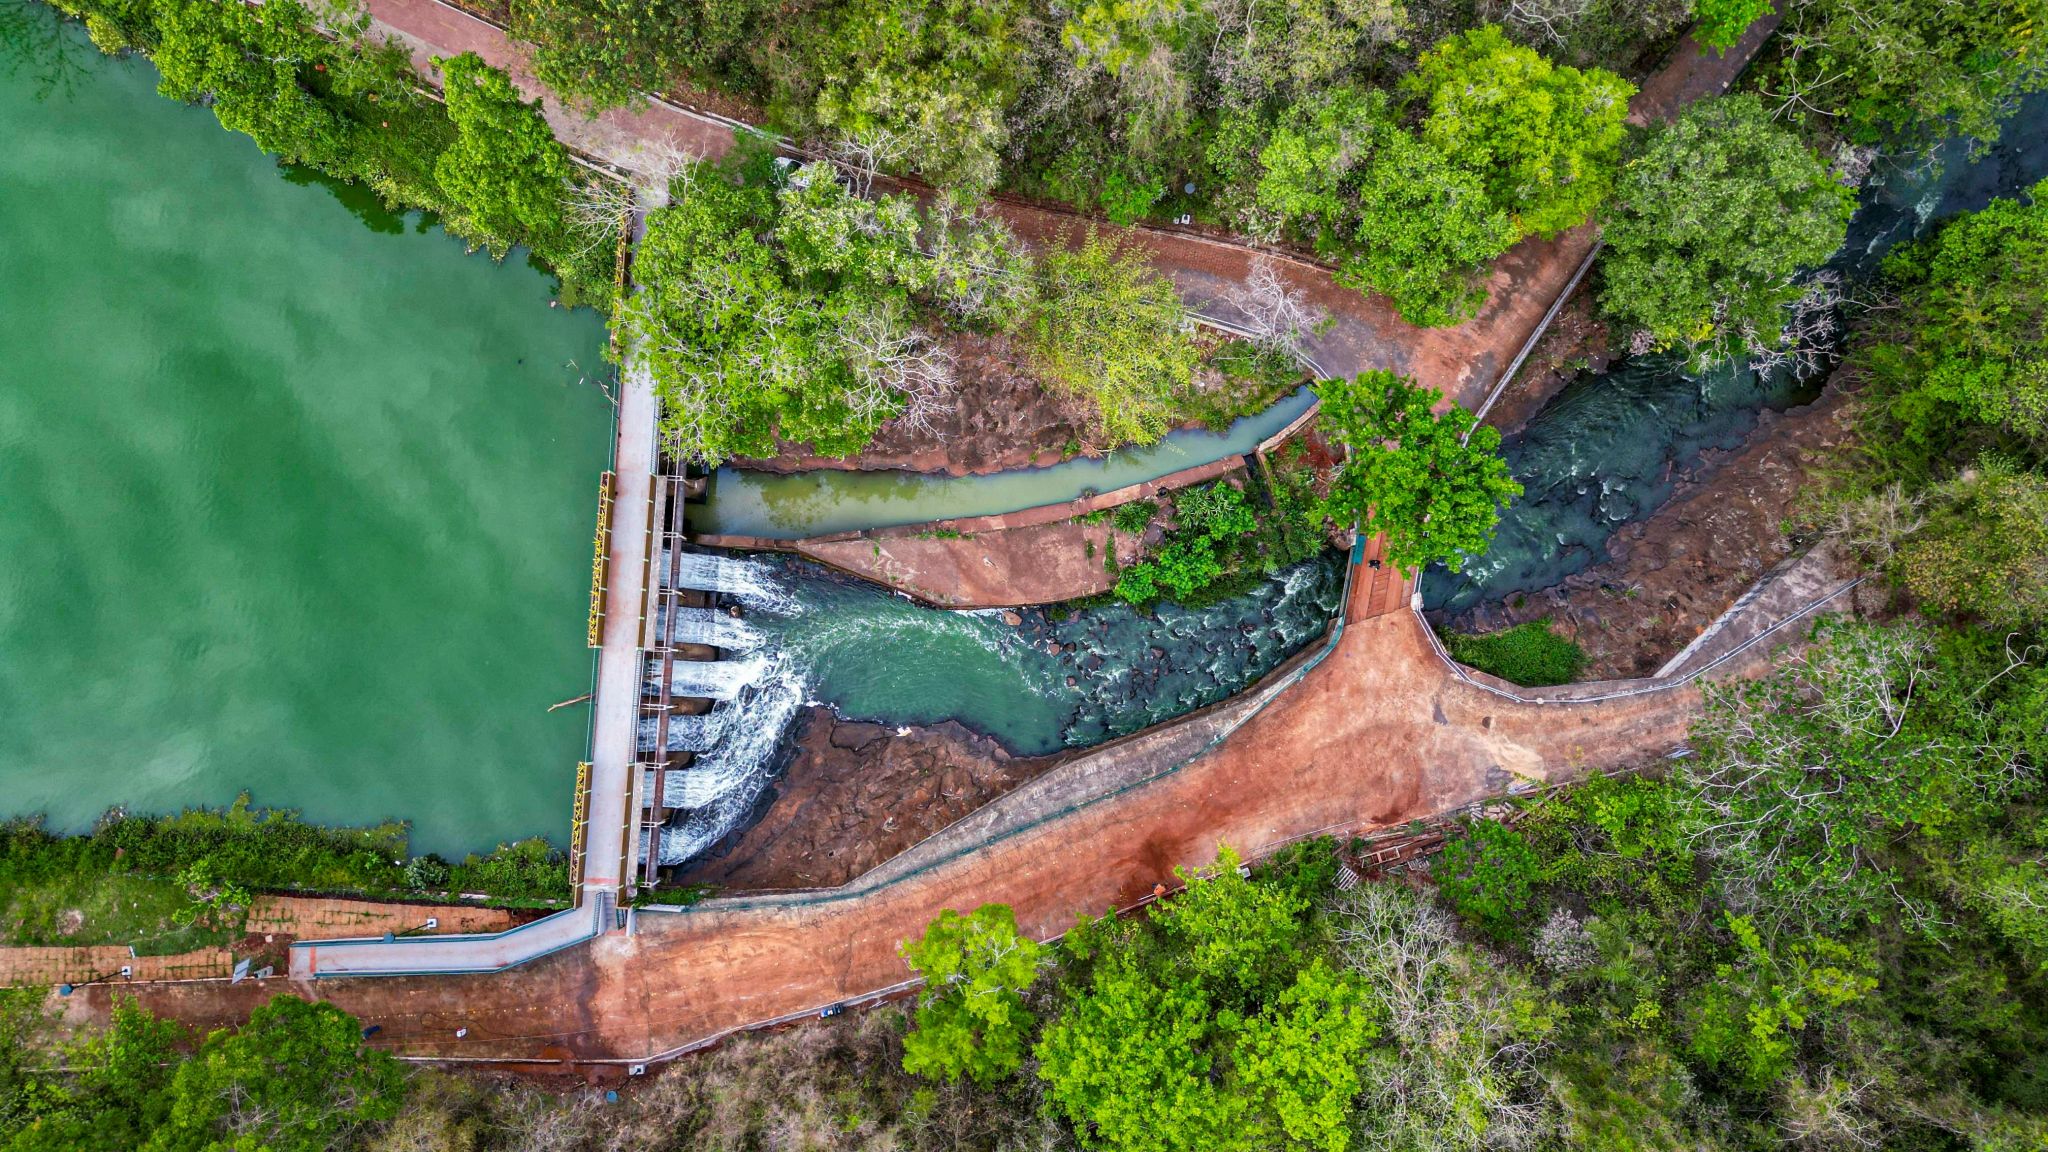
Water Quality Monitoring
Track pH, dissolved oxygen, turbidity, temperature, and conductivity over time. Compare readings across sites with built-in KPI time-series charts.
Wildlife & Condition Tracking
Log wildlife sightings with species counts and population estimates. Monitor asset conditions from good to critical and receive alerts on changes.
Photo Monitoring Stations
Register permanent photo points with GPS, compass bearing, and camera height. Return on a set cadence and upload repeat photos to build a visual time series — before/after pairs are embedded directly in funder reports.
Funder-Ready Reports
Generate PDF and CSV reports filtered by project, date range, or metric. Includes impact summaries with before-and-after KPI comparisons.
Team & Role Management
Add team members as admins, managers, field staff, or viewers. Control who can create projects, log observations, and access reports.
How It Works
From streamside to stakeholder in four steps
- 1
Map Your Restoration Site
Create a project, choose the ecosystem type, set acreage and budget, and draw its boundary directly on the interactive map.
Riparian, forest, wetland, grassland & more
- 2
Register Ecological Assets
Place pins for vegetation plots, check dams, monitoring wells, and exclosures. Record installation dates and baseline conditions.
GPS coordinates auto-captured
- 3
Log Observations in the Field
Field crews record vegetation surveys, water quality readings, wildlife sightings, and maintenance events. Attach geotagged photos and KPI measurements from any device.
Photo GPS extracted automatically
- 4
Report Impact to Funders
Generate reports filtered by project, date range, or metric. Export to PDF or CSV and share with grant agencies and stakeholders.
PDF, CSV & impact summaries
Our Mission
Built for the people restoring the land
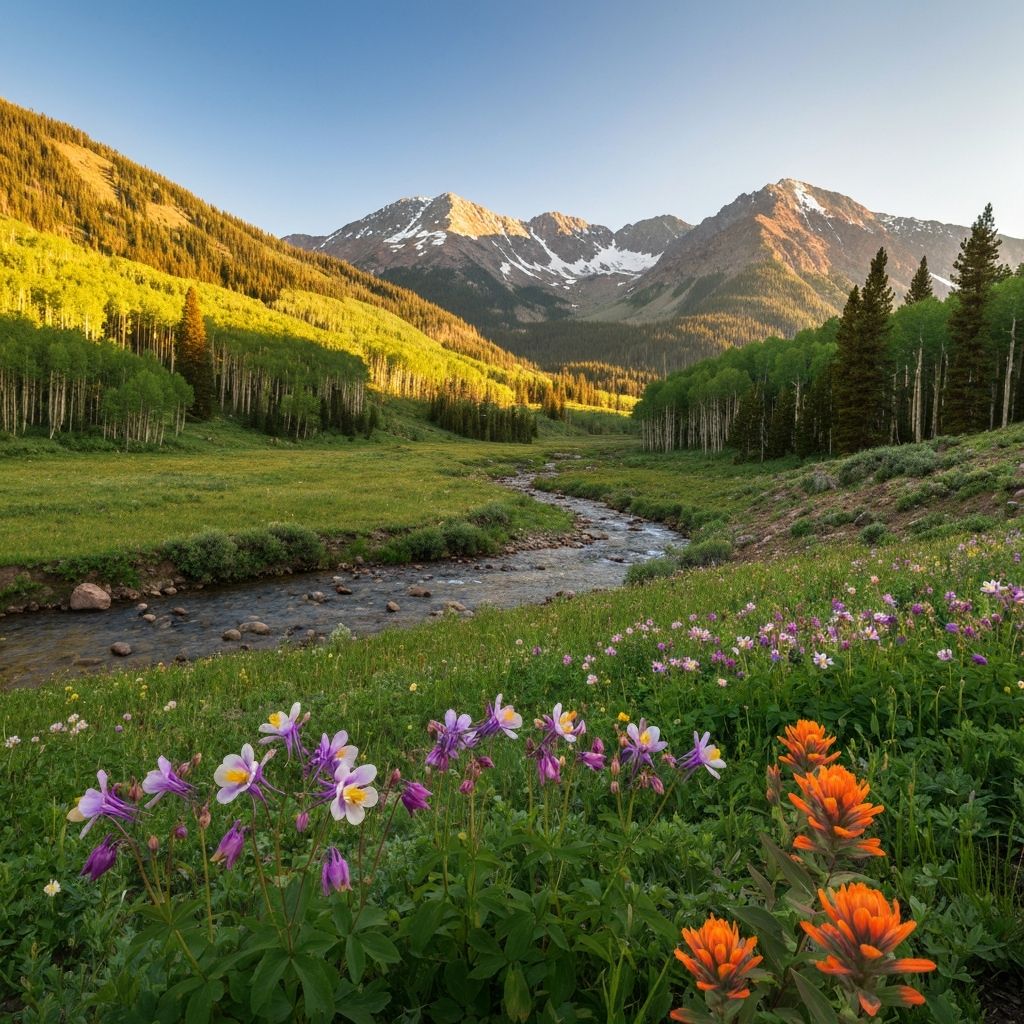
Every watershed tells a story -- of erosion and recovery, of loss and return, of communities coming together to heal the land. Reground exists because the people doing that work deserve tools as resilient as the ecosystems they protect.
We built Reground for land trusts, watershed coalitions, and conservation agencies -- so every feature meets the real demands of fieldwork, reporting, and long-term stewardship, from arid rangelands to coastal wetlands.
What You'll Track
Every metric that matters, in one place
Built for Every Ecosystem
Riparian Corridors
Track stream miles, buffer widths, bank stability scores, and water table depth. Log water quality KPIs like pH, dissolved oxygen, and turbidity.
Forest Health
Set target canopy cover and planting density. Monitor survival rates, native cover percentages, and tree density through vegetation surveys.
Wetland Mitigation
Record hydroperiod, wetland class, and water source type. Log soil samples with organic matter, nitrogen, and phosphorus readings.
Grassland & Rangeland
Set target native cover and seed mix rates. Track grazing management approach and measure progress with vegetation survey KPIs.
Pricing
Plans that scale with your team
Start with a 14-day free trial on any plan. No credit card required. Choose the tier that fits your organization and upgrade as you grow.

Ready to bring your restoration data together?
Create your free account and start tracking projects in minutes. No credit card required.
Free during beta. Upgrade anytime.